Northwind: Revenue Analytics Dashboard
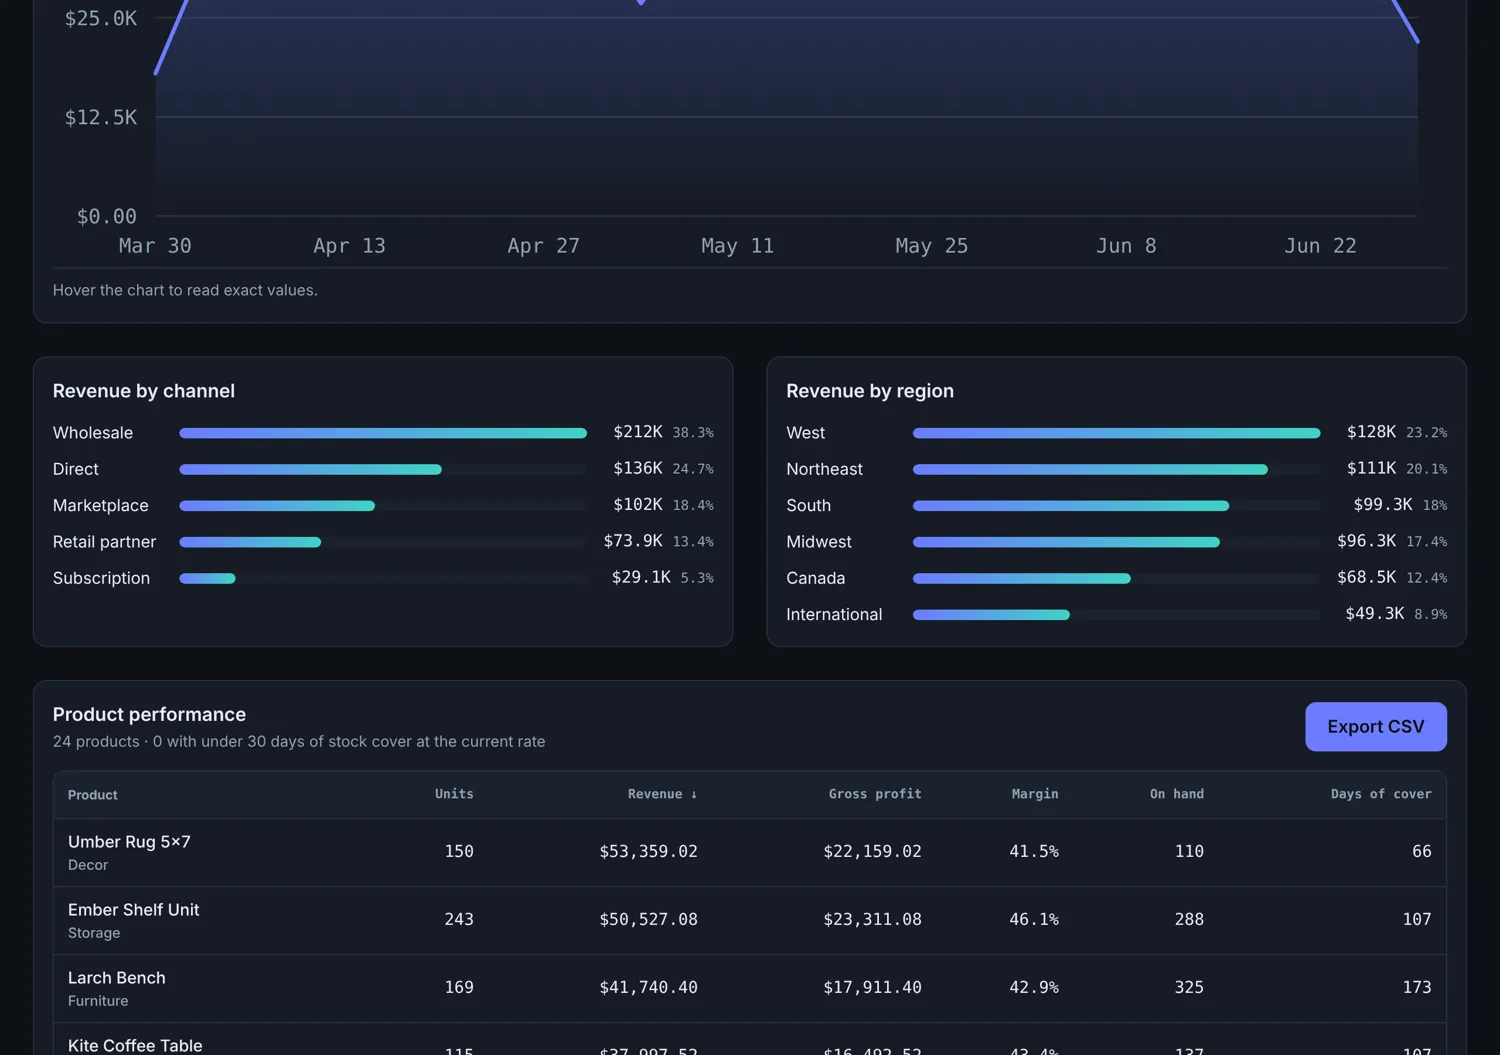
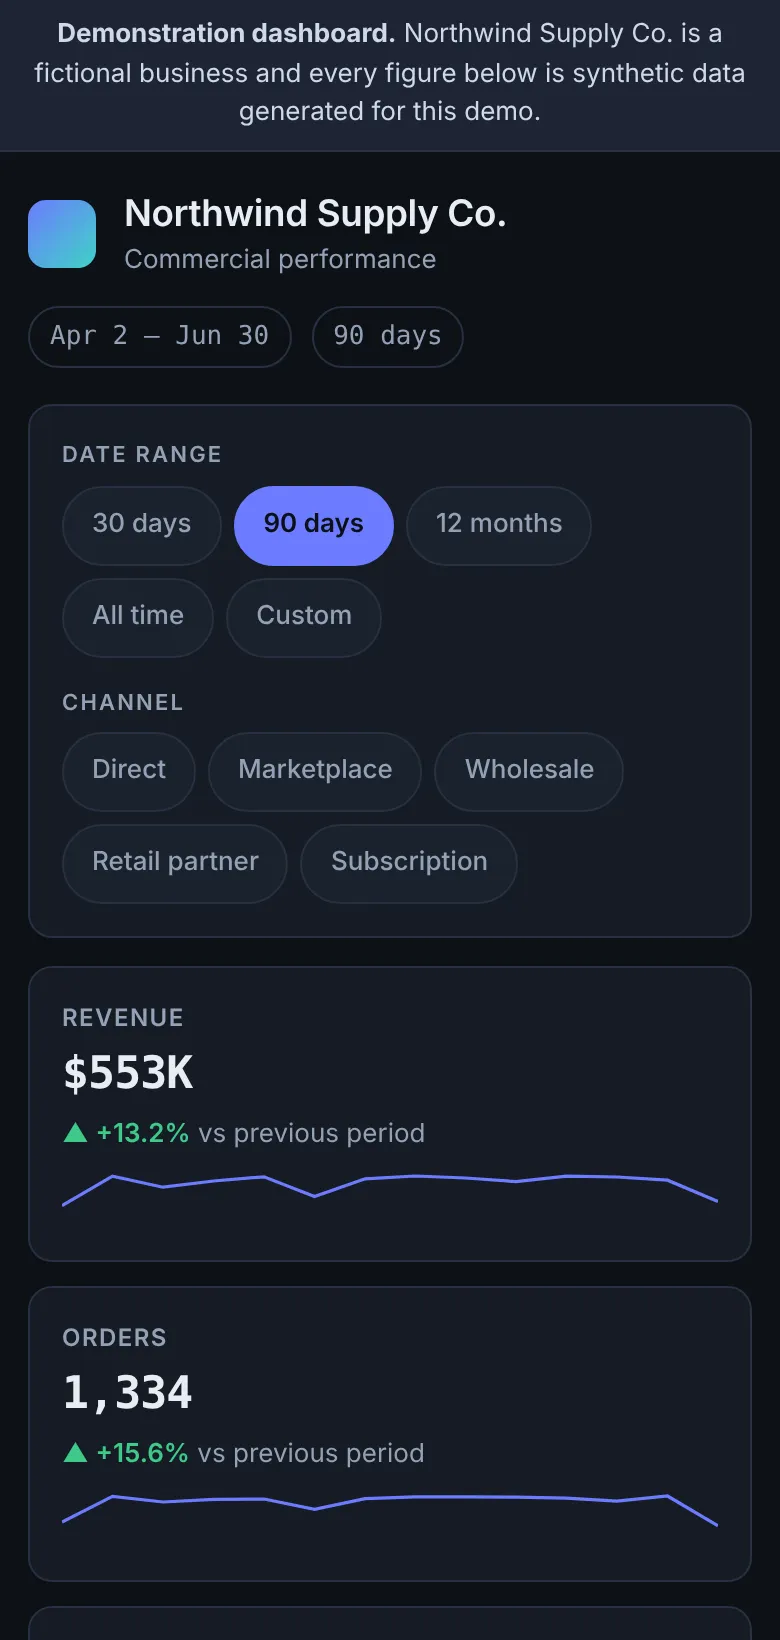
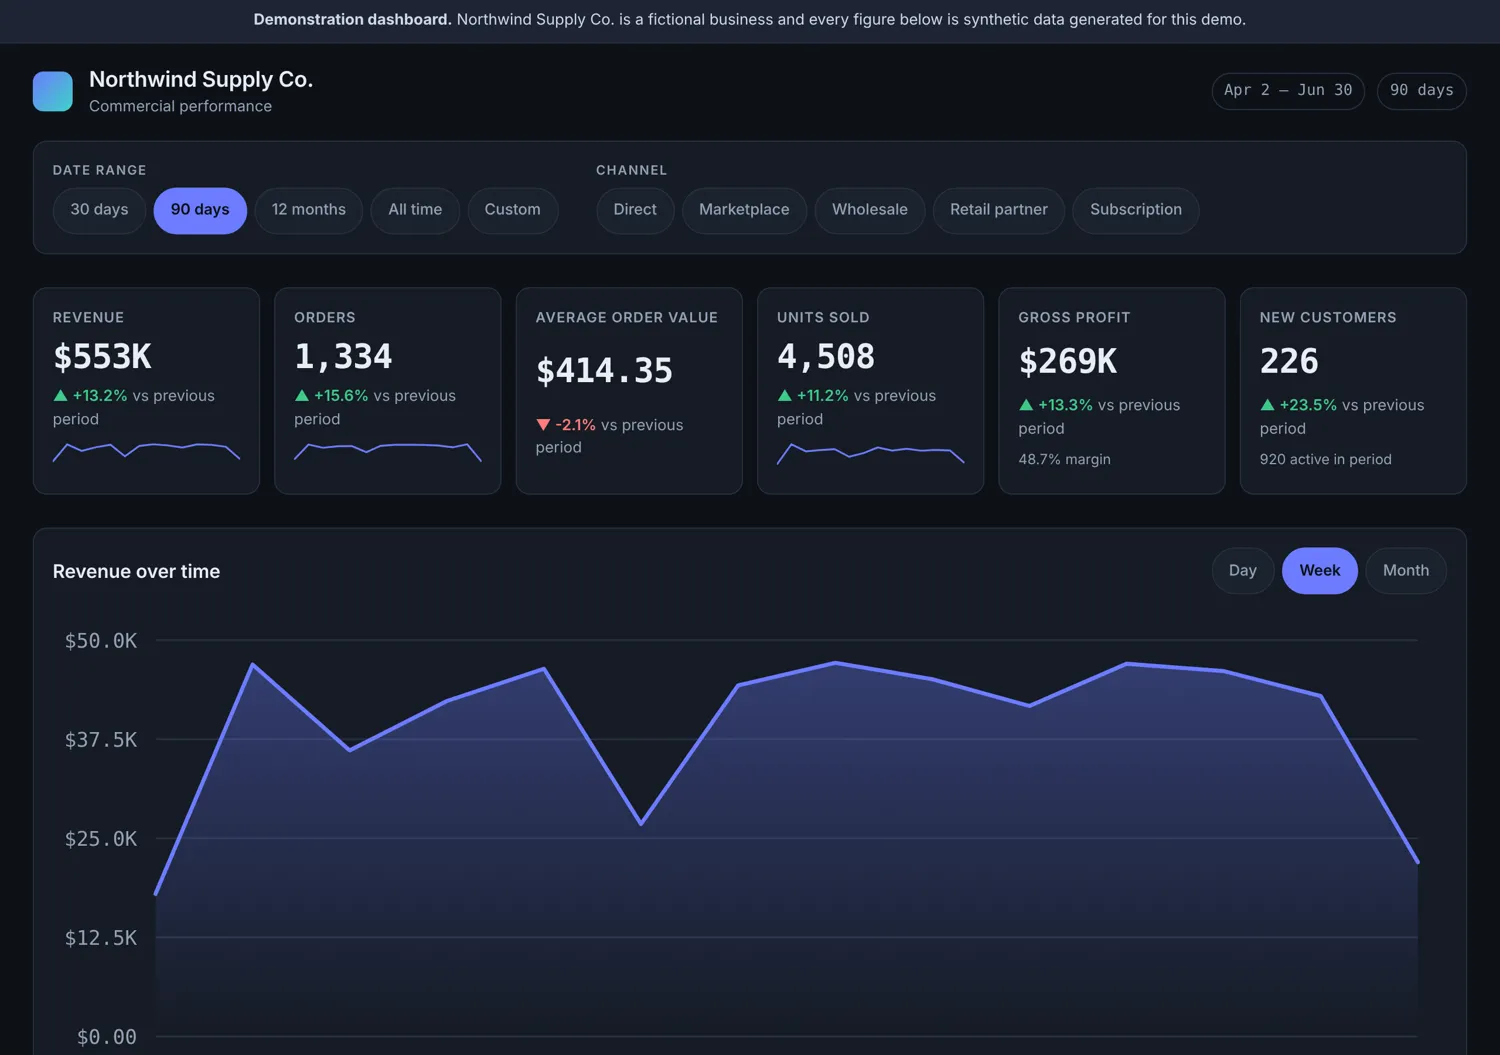
An analytics dashboard over 7,146 generated orders: period comparison, revenue trends, channel and category breakdowns, and a sortable product table with CSV export. Every chart is hand-drawn SVG with a table alternative for screen readers.
This is a working demonstration, not a client engagement. The brand and data are fictional.
Background
Northwind is an invented wholesaler. The dashboard exists to show how a reporting interface should behave when the numbers are real and have to agree with each other, rather than being a layout exercise over a static JSON blob.
The challenge
Dashboard demos usually hard-code their figures, so nothing can disagree and nothing can be wrong. The interesting problems only appear once the data is generated: comparisons against the correct previous period, buckets that do not drop the final partial week, and a headline figure that still matches the table beneath it after a filter is applied.
Objectives
- Generate a dataset substantial enough that the analytics have something real to be wrong about.
- Make every figure on the page derive from one source, so the headline tiles and the table cannot disagree.
- Compare each period against the correct previous period rather than an arbitrary offset.
- Keep the charts readable without sight of them.
My role
Sole designer and developer
- Wrote the deterministic data generator: 24 products and roughly 7,100 orders across 18 months, seeded so every run produces the same figures
- Built the analytics layer: period summaries, previous-period comparison, time bucketing, grouping and product performance
- Drew the revenue chart, breakdown bars and sparklines as SVG by hand, with no charting library
- Gave every chart a visually hidden data table, so the figures are available to screen readers rather than locked in a picture
- Implemented CSV export from the same data the table renders
- Wrote 15 unit tests over the analytics functions and 14 browser checks over the interface
Technical approach
A seeded linear congruential generator produces the orders, so the dataset is identical on every load and tests can assert exact values against it. The analytics functions are pure and separately testable; the interface only renders what they return.
What is implemented
- Period selector with correct previous-period comparison and percentage deltas
- Revenue trend chart with day, week and month granularity
- Channel and category breakdowns driven by the same filters
- Sortable product performance table with CSV export
- Hand-drawn SVG charts with a visually hidden data table behind each one
Process
- Built the generator with a fixed seed, modelling seasonality, channel mix and a customer base that grows month over month.
- Wrote the analytics layer (summarise, delta, previousPeriod, bucketOf, timeSeries, groupBy, productPerformance) with unit tests asserting exact figures.
- Drew the chart components as SVG, sizing and labelling axes from the data rather than from fixed pixel values.
- Added a visually hidden table alongside every chart so the same figures are reachable without sight of the graphic.
- Wrote the browser suite, which caught the generator defect described below.
Engineering and creative decisions
A seeded generator, not a fixture file
A linear congruential generator with a fixed seed produces the same ~7,100 orders on every load. That makes exact assertions possible in tests while keeping the data varied enough to exercise the grouping and bucketing code.
Pure analytics functions
summarise, delta, previousPeriod, bucketOf, timeSeries, groupBy and productPerformance take data and return data. The interface renders what they return and computes nothing itself, so a disagreement between a tile and a table is impossible by construction.
No charting library
The charts are SVG written for this project. It keeps the bundle small, and it means the axis labels and tick spacing are computed from the data rather than from a library's defaults.
Every chart has a table
Each chart ships with a visually hidden table of the same figures. A screen reader gets the numbers rather than an alt attribute summarising them.
What was delivered
A dashboard where the headline tiles, charts, breakdowns and product table are all derived from one dataset, so they cannot contradict one another. Changing the period or granularity recomputes everything from source.
Results
- 15 unit tests and 14 browser checks pass against the generated dataset.
- Testing caught a real generator defect: every customer was created in the first months, so "new customers" read 0 and −100% for every later period. Fixed with a customer pool that grows over time.
- Several of my own test expectations were wrong, and the application was right: the dataset is 7,146 orders, not the 8,000+ I had assumed. The tests were corrected to the real figures rather than the figures being nudged to fit.
- No charting library: the production bundle carries no chart dependency at all.
These are tested capabilities of the demonstration, not commercial outcomes.
Technology stack
Visual demonstration
Captured from the running application.