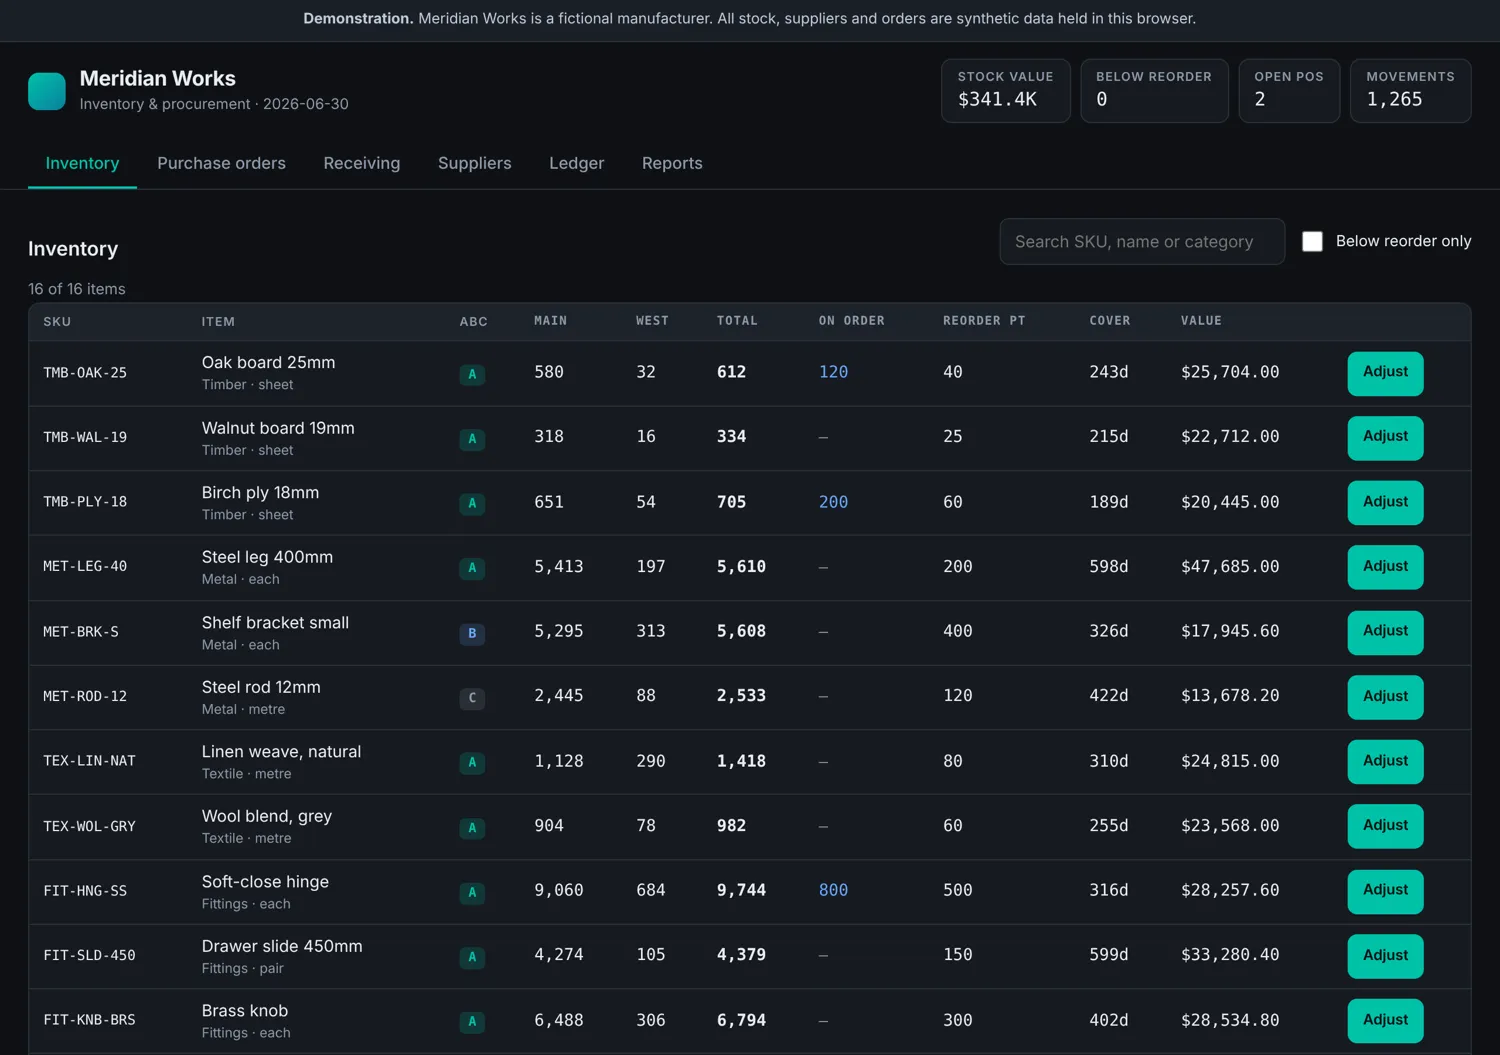
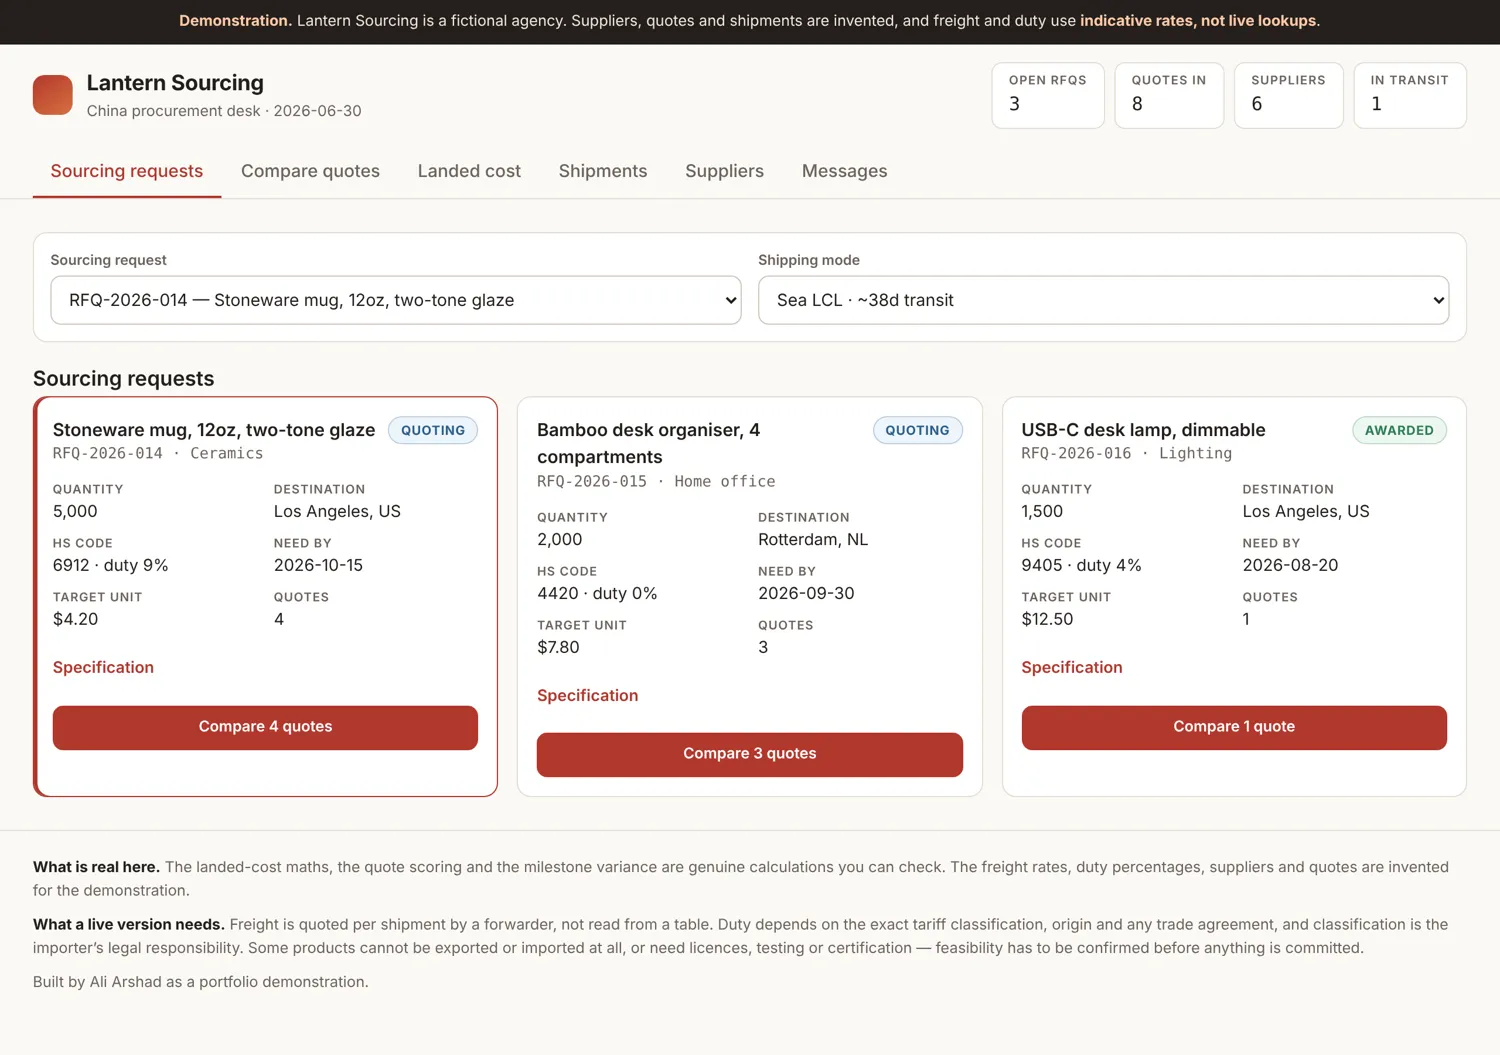
All work
Northwind: Revenue Analytics Dashboard
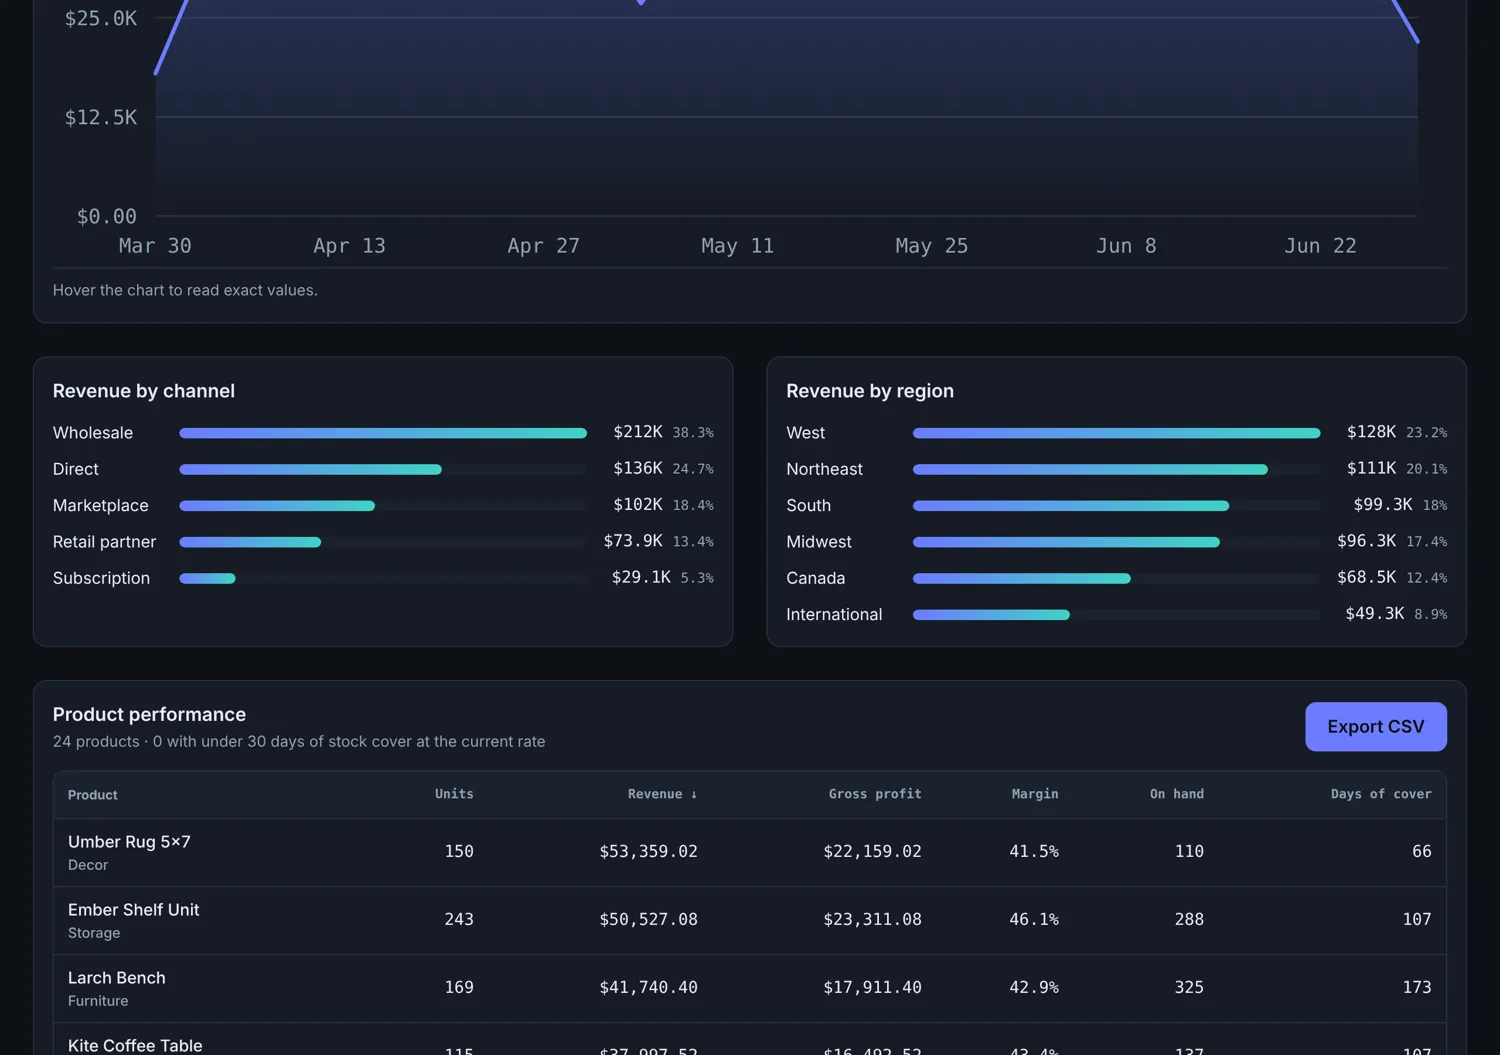
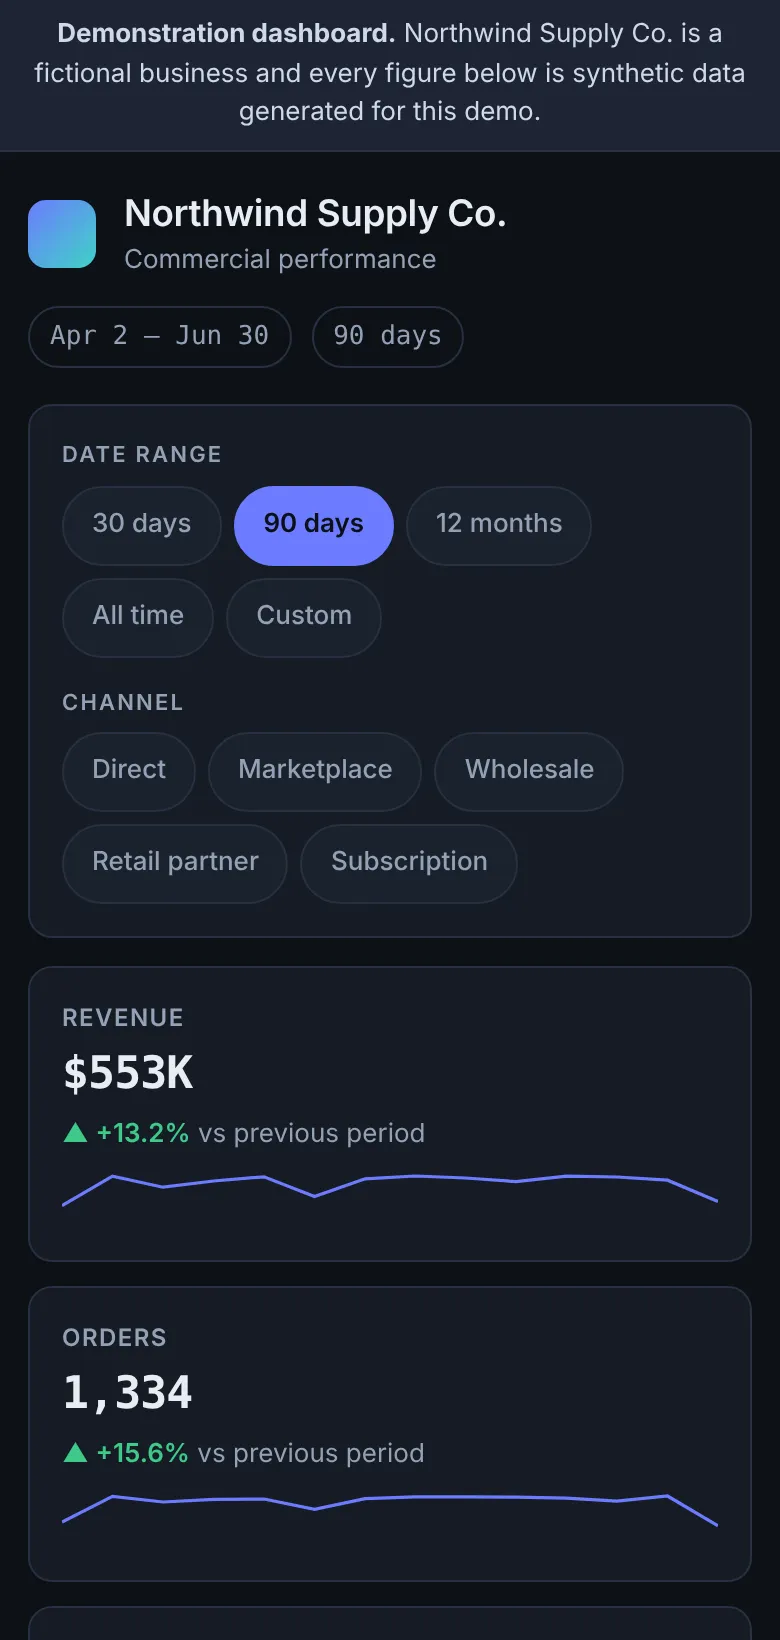
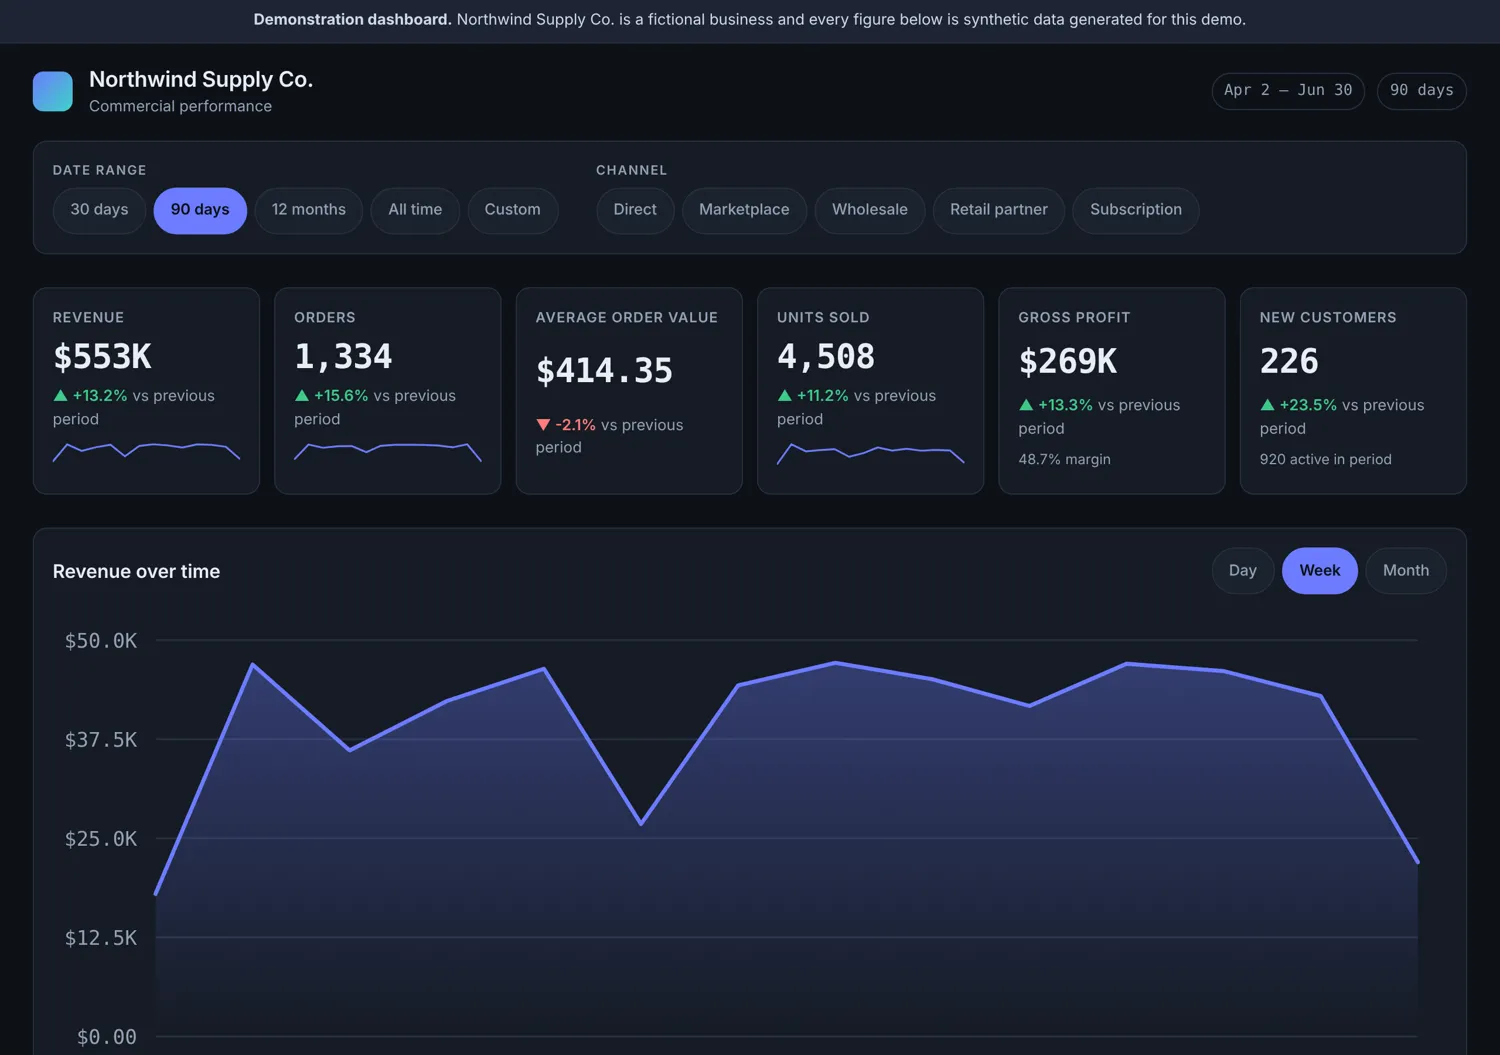
An analytics dashboard over 7,146 generated orders: period comparison, revenue trends, channel and category breakdowns, and a sortable product table with CSV export. Every chart is hand-drawn SVG with a table alternative for screen readers.
This is a working demonstration, not a client engagement. The brand and data are fictional.
My role
Sole designer and developer
- Wrote the deterministic data generator: 24 products and roughly 7,100 orders across 18 months, seeded so every run produces the same figures
- Built the analytics layer: period summaries, previous-period comparison, time bucketing, grouping and product performance
- Drew the revenue chart, breakdown bars and sparklines as SVG by hand, with no charting library
- Gave every chart a visually hidden data table, so the figures are available to screen readers rather than locked in a picture
- Implemented CSV export from the same data the table renders
- Wrote 15 unit tests over the analytics functions and 14 browser checks over the interface